Strip Chart Display
StripChart is a wxPython GUI application for viewing time traces of PVs as a strip chart. It feature interactive graphics, with click-and-drag zooming, updating the plotted time range, saving figures as high-quality PNGs, and saving data to ASCII files. Stripchart is inspired somewhat by the classic Epics Stripchart application written with X/Motif, but has many differences.
Running Stripchart
To run the Stripchart application from the command line, use:
epicsapps stripchart
and enter the base name of the PVs to follow. Running
epicsapps -m
will create a folder on your Desktop called “Epics Apps” with a runnable link for the stripchart application.
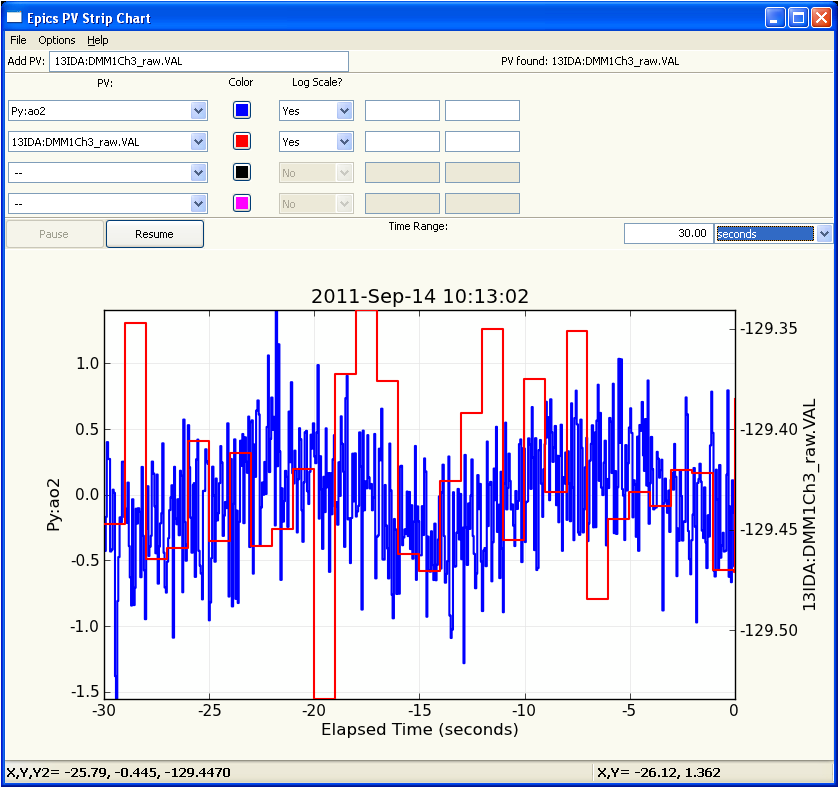
A sample display would look like this:
Usage
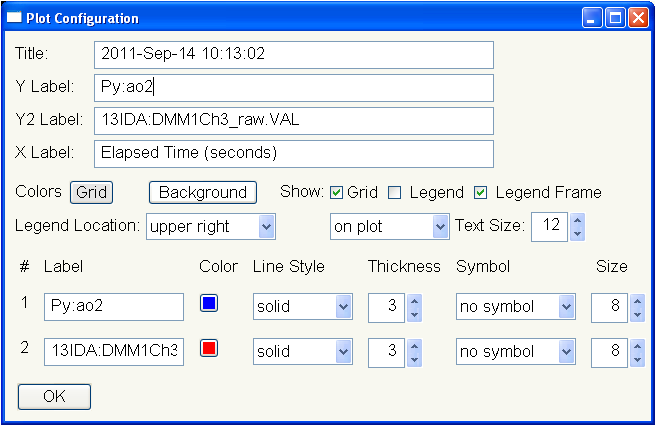
Plot details can be adjusted from the configuration form, available from the Options Menu, and shown below. From this frame, you can adjust trace colors, symbols, line width and style, symbol size and styles, axes labels, and the contents and location of a plot legend. Text for titles, axes labels, and legend can include latex strings for math/Greek characters.
From the main plot, Ctrl-C works to copy to the system clipboard, and Ctrl-P will open a print dialog.